Chapter 1
Click here for ch. 1 project
In chapter 1, my partner and I conducted a study on how many hours of sleep a participant gets a night. Our goal was to figure out the difference between students and how many hours of sleep they get per night on the weekdays and weekends. We found out that students get more sleep on the weekends than they do the weekdays. From this project, we learned how to create and conduct a survey.
In chapter 1, my partner and I conducted a study on how many hours of sleep a participant gets a night. Our goal was to figure out the difference between students and how many hours of sleep they get per night on the weekdays and weekends. We found out that students get more sleep on the weekends than they do the weekdays. From this project, we learned how to create and conduct a survey.
Chapter 2
Click here for ch. 2 project
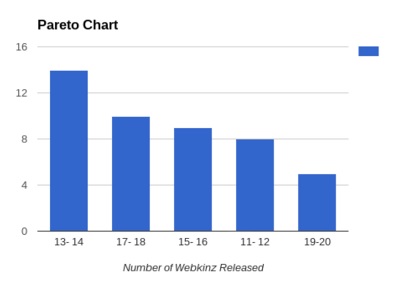
In chapter 2, my partner and I conducted a study on the number of Webkinz plush animals released every month from 2009 to 2012. Our goal was to record the months that had double digits for the number of Webkinz released. We found out that the number of of Webkinz released, 14-16, was the most frequent. From this project we learned how to create different types of charts and graphs.
In chapter 2, my partner and I conducted a study on the number of Webkinz plush animals released every month from 2009 to 2012. Our goal was to record the months that had double digits for the number of Webkinz released. We found out that the number of of Webkinz released, 14-16, was the most frequent. From this project we learned how to create different types of charts and graphs.
Chapter 3
Click here for ch. 3 project
In chapter 3, my partner and I conducted a study on a data set that showed the protein count for 50 different cereals. Our goal was to create varies charts and graphs concerning the data. We found out that how to make many graphs and answer certain questions using our data. For example we were able to find the mean, median, mode, and range, trimmed means, and standard deviation. From this project we learned how to answer different questions concerning data. We learned how to insert our data in the calculator to find various answers.
In chapter 3, my partner and I conducted a study on a data set that showed the protein count for 50 different cereals. Our goal was to create varies charts and graphs concerning the data. We found out that how to make many graphs and answer certain questions using our data. For example we were able to find the mean, median, mode, and range, trimmed means, and standard deviation. From this project we learned how to answer different questions concerning data. We learned how to insert our data in the calculator to find various answers.
Chapter 4
Click here for ch. 4 project doc
Click here for ch. 4 project sheet
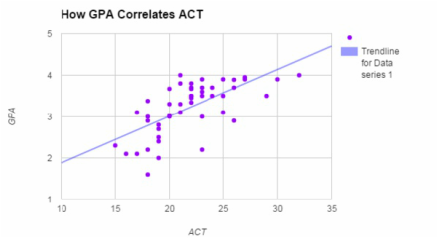
In chapter 4, my partner and I conducted a study on the senior class’ accumulative GPA and their ACT score. Our goal with this project was to discover if the senior class accumulative GPA affected their ACT score. Before we conducted the study, we did not believe that the students’ GPA and their ACT score correlate. After our project, we determined that the seniors’ accumulative GPA moderately affects their ACT score. From this project, we learned how to computer marginal change, least squared regression, and coefficient of determination. We also learned how to create a scatter diagram with our data.
Click here for ch. 4 project sheet
In chapter 4, my partner and I conducted a study on the senior class’ accumulative GPA and their ACT score. Our goal with this project was to discover if the senior class accumulative GPA affected their ACT score. Before we conducted the study, we did not believe that the students’ GPA and their ACT score correlate. After our project, we determined that the seniors’ accumulative GPA moderately affects their ACT score. From this project, we learned how to computer marginal change, least squared regression, and coefficient of determination. We also learned how to create a scatter diagram with our data.
Chapter 5
Click here for ch. 5 project
In chapter 5, my partner and I did our project on a scenario of drawing 2 marbles from a bag that contains 5 green and 6 red marbles. For this project, our goal was to find the probability of drawing 2 marbles from a bag which contains 5 green and 6 red marbles. We found out that that we have a 5/11 chance of drawing a green marble and 6/11 chance of drawing a red marble. From our project, we learned what it means for two events to be dependent or independent, the multiplication rule of counting, and how to calculate permutation.
In chapter 5, my partner and I did our project on a scenario of drawing 2 marbles from a bag that contains 5 green and 6 red marbles. For this project, our goal was to find the probability of drawing 2 marbles from a bag which contains 5 green and 6 red marbles. We found out that that we have a 5/11 chance of drawing a green marble and 6/11 chance of drawing a red marble. From our project, we learned what it means for two events to be dependent or independent, the multiplication rule of counting, and how to calculate permutation.
Chapter 6
Click here for ch. 6 project
In chapter 6, my partner and I summarized terms from the book that related to probability distribution and binomial experiments. For example, we talked about how to calculate with the binomial pdf & cdf and and random variables. We also learned how to calculate probabilities for winning the Powerball.
In chapter 6, my partner and I summarized terms from the book that related to probability distribution and binomial experiments. For example, we talked about how to calculate with the binomial pdf & cdf and and random variables. We also learned how to calculate probabilities for winning the Powerball.
Chapter 7
Click here for ch. 7 project
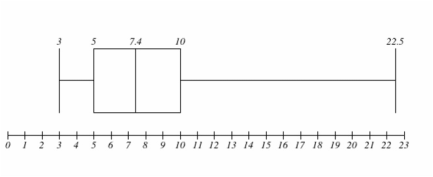
In chapter 7, my partner and I chose 50 random samples and recorded the number of pets they have. With our data, we made a histogram, found the five number summary, and answered many questions using our data set. We also found the sample standard deviation by finding the mean. We also made a histogram to show us the shape our data would make when it was put into a histogram. In this chapter, we also found the empirical rule and z scores.
In chapter 7, my partner and I chose 50 random samples and recorded the number of pets they have. With our data, we made a histogram, found the five number summary, and answered many questions using our data set. We also found the sample standard deviation by finding the mean. We also made a histogram to show us the shape our data would make when it was put into a histogram. In this chapter, we also found the empirical rule and z scores.
Chapter 8
Click here for chapter 8 project
In chapter 8, my partner and I were assigned a data set. Our data was home run percentages for professional baseball players. With our data, we found the sample size, sample mean, margin of error, and critical values. This project helped us to understand how to calculate many different variables in this chapter.
In chapter 8, my partner and I were assigned a data set. Our data was home run percentages for professional baseball players. With our data, we found the sample size, sample mean, margin of error, and critical values. This project helped us to understand how to calculate many different variables in this chapter.
Chapter 9

Click here for chapter 9 project
In chapter 9, my partner and I surveyed 22 senior girls at Fowler High School on the average number of minutes spent on Facebook daily. With this data we were able to compute many different variables including a sample mean & standard deviation, level of significance, degrees of freedom, and a p-value. We concluded that the average number of minutes that senior girls at Fowler High school spent 21.91 minutes on Facebook in a day.
In chapter 9, my partner and I surveyed 22 senior girls at Fowler High School on the average number of minutes spent on Facebook daily. With this data we were able to compute many different variables including a sample mean & standard deviation, level of significance, degrees of freedom, and a p-value. We concluded that the average number of minutes that senior girls at Fowler High school spent 21.91 minutes on Facebook in a day.
Chapter 10
Click here for chapter 10 project
In chapter 10, my partner and I were able to computer many different variables including null and alternate hypothesis, level of significance, a sample test statistic, and a confidence interval. When we computed our confidence level we were able to tell the differences between Field A and Field B. We discovered that Field A has a higher water content.
In chapter 10, my partner and I were able to computer many different variables including null and alternate hypothesis, level of significance, a sample test statistic, and a confidence interval. When we computed our confidence level we were able to tell the differences between Field A and Field B. We discovered that Field A has a higher water content.
Final Reflection
One thing I took away from Statistics class was the valuable skills I learned this year. Being able to find data and then compute different variables involving the data was a very important skill that I think will be useful to me in my future. This will be important for my future because my career may eventually need me to analyze data and compute many different variables using that data. One aspect that was different in this class than what I expected was the projects. Each chapter we did a project with one partner. Completing the project with a partner helped me to better understand time management, collaborate efficiently with a partner, and divide work evenly. I enjoyed working on group projects this year and it really helped prepare me for my future. I enjoyed having Statistics class this year and took away valuable lessons from this class.
